Atlanta Sports don't just lose - they do something Painfully Peculiar
- Feb 7, 2017
- 2 min read
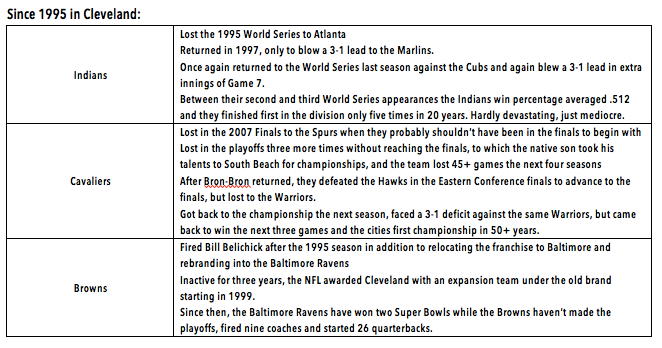
Atlanta usually flies under the radar when most people talk about the most agonizing cities to live in for sports fans. Most of the attention had been paid to Cleveland, but with the Cavaliers winning a title and the Indians making it to the World Series, they’re no longer the most tortured. Step aside, Cleveland - it’s Atlanta’s turn to be the best at being the worst.
To get the ball rolling, we’ll list out the agonizing moments. What you read below may cause pain or discomfort and bring back horrifying memories. Reader discretion is advised.
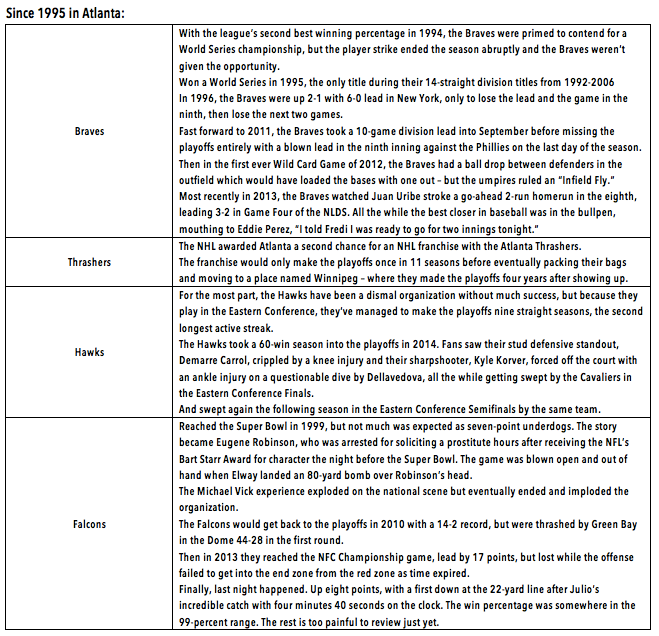
The list might be longer for Atlanta because I’m more familiar with the reel of comedic errors in Atlanta sports, but I don’t think Atlanta gets enough credit for being more tortured than Cleveland.
Sure, Cleveland had the longer drought than Atlanta, but for the most part their teams were simply bad. Misery can be easier to cope with than what Atlanta does to its fans.
Their teams give you just enough hope to trust them all the way to the end. They wait to lose in the most soul shattering fashion when everyone is watching. They do just enough to convince you, “Nah, this team is different than the last time we were in this situation.”
Atlanta fans are eternally stuck drinking watered down Kool-Aid, even though they keep asking the bartender for stronger stuff.
It’s not a curse – there’s never been a black cat or a Bambino. It’s not that long of a drought – I’m older than Atlanta’s championship drought. It’s frustration and perpetual blue balls. And it’s not done on our own time when nobody else is watching. No, no, no. Atlanta waits for the entire country to walk in on us while our pants are down.
It’s what adds to the frustration. It’s why I came up with this Frustration Index last year. Check this link to catch up on how it was developed when I originally constructed it, and check in below to see the updated standings.
Championship Droughts in cities with at least three professional teams
1. Minneapolis/St. Paul: 26 years - 1991 World Series Champs
2. Washington DC: 25 years - Super Bowl XXVI (1992) Champs
3. Toronto: 24 years - 1993 World Series Champs
4. Atlanta: 22 years - 1995 World Series Champs
Percentage of Playoff Appearances in combined Seasons since last Championship
1. Atlanta Braves/Falcons/Hawks/Thrashers: 37/77 (48%)
2. Washington Redskins/Capitals/Wizards/Nationals: 34/89 (38%)
3. Minnesota Twins/Vikings/Timberwolves/Wild: 34/95 (35%)
4. Toronto Blue Jays/Raptors/Maple Leafs: 21/69 (30%)
Playoff Record and Playoff Winning Percentage
1. Toronto Blue Jays/Raptors/Maple Leafs: 101-119 / .459
2. Washington Redskins/Capitals/Wizards/Nationals: 99-142 / .410
3. Atlanta Braves/Falcons/Hawks/Thrashers: 91-132 / .408
4. Minnesota Twins/Vikings/Timberwolves/Wild: 53-100 / .346
Number of League/Conference Championships and Finals appearances
1. Atlanta: 13 appearances
2. Toronto: 5 appearances
3. Minnesota: 4 appearances
4. Washington: 2 appearances
Finally, the frustration rankings - which are ranked based on the highest average rank in the previous indexes
1. Atlanta: 2.25 score
2. Washington: 2.25 score
3. Minnesota: 2.5 score
4. Toronto: 2.5 score
Yes, Atlanta and Washington are tied atop the rankings – but Atlanta takes the cake because of it’s overwhelming number of conference championship and finals appearance against the rest of the competition. In addition, Atlanta won two out of the four categories while Washington didn’t win any.
Congrats Atlanta, you are now officially the champion of being championship-less.

Comments